Table of Contents
System Info
The System Info plugin can monitor disk space, disk usage, network usage and errors. No units are created automatically by this plugin, you can create them for whatever of the available metrics you desire to track.
This plugin duplicates some of the functionality of the older UPS and Disk Space Plugin who’s disk space reading support should be considered deprecated. For future setups please use this plugin instead of the disk space monitoring in that plugin. The locally connected UPS functions of that plugin are not deprecated.
XTension Settings:
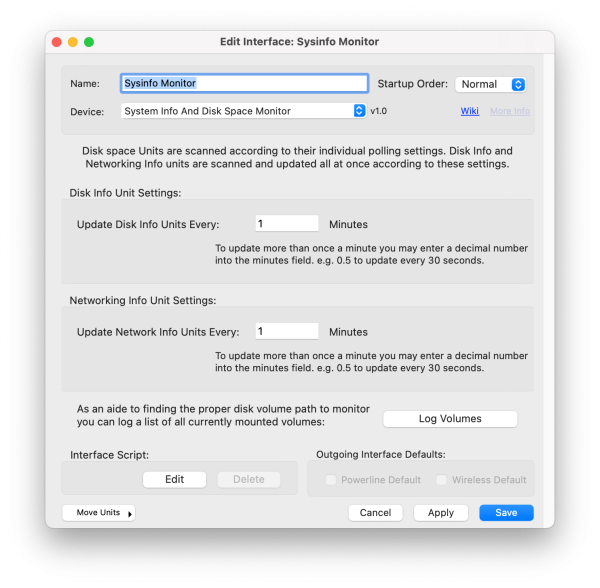
Disk space units can be set to update individually. The setting for their interval is on their individual Unit setup pages and not on the plugin general settings.
Disk info Units, such as read and write counts or read and write time are updated all together at the interval set here.
Networking Units, such as read/write amounts and errors are also updated all together at the interval set here.
Log Volumes: button causes the system to write all the mounted partitions to the log. Especially with AFPS disks the point you need to monitor many not be the obvious choice and this can help you find what the real underlying path to the volume is. In the case of the mount disk it is almost always going to be /System/Volumes/Data and not the more obvious /Volumes/Macintosh HD or whatever you have named the volume.
Disk Space Units:
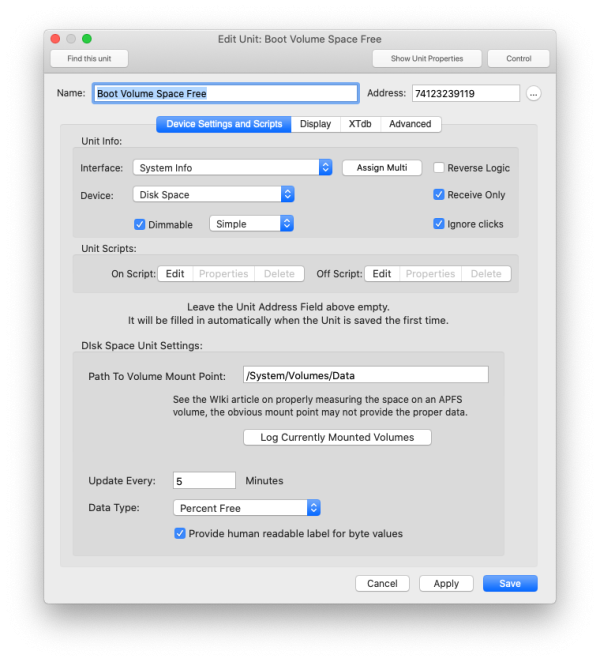
When creating Disk Space Units please leave the Address field blank. It will be filled in automatically after saving the Unit.
Path To Volume Mount Point: The system path to the volume you wish to monitor. You can create any number of Units pointed to the same volume using different data types below to get multiple infos from the same disk. See the Log Volumes explanation above for more info on finding the correct path to the volume. Especially APFS boot volumes are not the obvious answer.
Log Currently Mounted Volumes: This button performs the same function as the Log Volumes button on the Edit Interface window. Please check the section above for more info.
Update Every: How many minutes between updating the value. If you wish to scan this more often than once a minute you can enter a decimal number here like 0.5 to scan every 30 seconds.
Data Type: Select the type of data you wish to read. Choices are “Percent Free”, “Percent Used”, “Bytes Free”, “Bytes Used”
Provide Human Readable Label: The raw value of the Unit will always be the full number of bytes however that is not always useful for glancing at the Unit value. If this checkbox is set then an approximation of the value will be set as the default label for the unit. This will say something like “5GB” or “2TB” or “300M” or similar. This does not affect the value of the Unit only the display. If you use a script to get the value it will contain the full number as usual. This is just an aid to readability.
Disk Info Unit:
The Disk Info Unit can be used to monitor disk usage and may be set to read/write counts, read/write bytes or read/write times. These may be useful to see when the machine is doing the most work or if a drive is getting slower over time giving a hint as to it’s health.
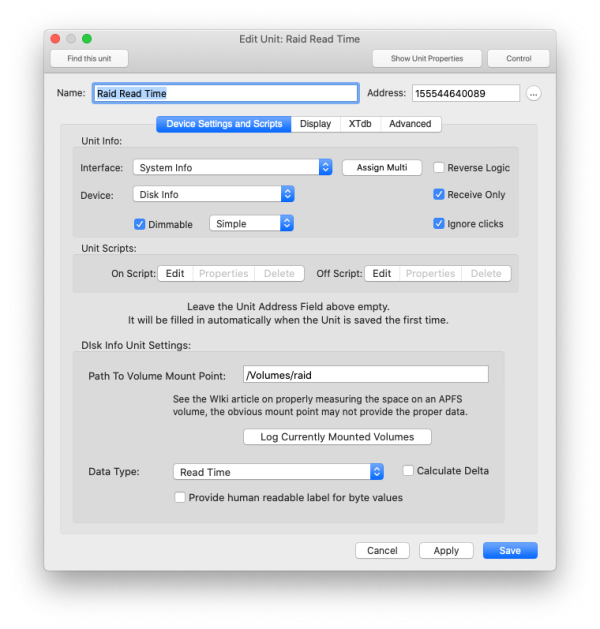 Path To Volume Mount Point: Please see the discussion in the sections above describing how to get the best path for reading the information you want.
Data Type: Select from the data type you wish to display. You can create multiple Units pointed to the same volume mount point to show or graph other data types. Selections include: “Read Count”, “Write Count”, “Read Bytes”, “Write Bytes”, “Read Time”, and “Write Time” What these values actually mean, if anything, can be looked up separately as the discussion of what counts as a failing or flagging disk is beyond the discussion of this article. From here they may be used just to verify the proper functioning or to log and map the periods of usage to verify operation or to look for unusual activity.
Calculate Delta: This setting sets the value of the Unit to the difference between the previous reading and the current one. When the Unit first starts up the value label will display “waiting” or something similar to indicate that it is eaiting for the second reading before it can send a delta value. This may not make sense for some of the data types, but is available for all of them if it is the info you’re looking for. In the case of the Disk Info Unit most of the values are already the deltas so turning this on may cause the output to be more confusing not less. It is probably more use in the Network Information Unit below.
Provide Human Readable Label for byte values: If checked the Unit label will be set to a more readable, but less exact value such as “5G”, “45m”, or “380K”. This effects only the label of the value. The actual numerical value of the Unit is unchanged and will be the correct, raw value of the data.
Note that the timing of the scans for Disk Info are set in the Interface Setup window as described in that portion above. Since all the data for all the disks is collected at once it makes sense to update all the Units on the same schedule.
Network Interface Information Units:
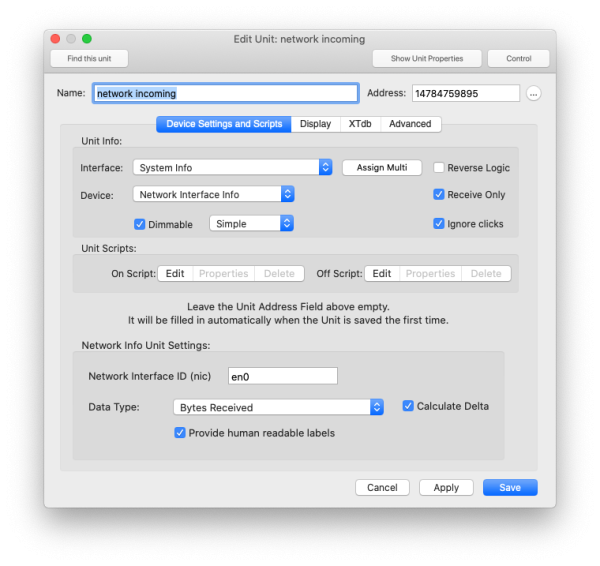
When creating Network Information Units please leave the Address field blank. It will be filled in automatically after saving the Unit.
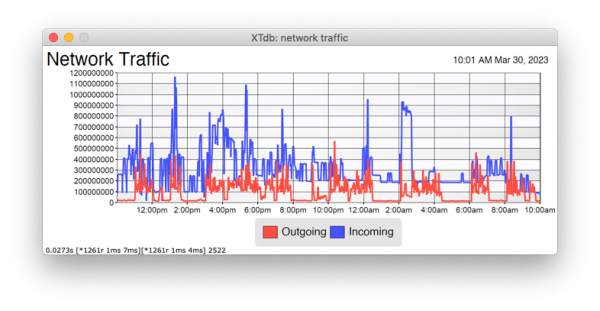
Network Interface Information Units can collect traffic and error information about individual network connections. This can be useful to show activity at various times, like the screen shot at the top of this article, as well as to watch for network errors. I am not completely sure how valuable or accurate the network error counts are so you shouldn’t use the fact that they may be remaining at 0 as an indication that the interface is actually working properly. In my case while tracking down a bad ethernet cable where my connection was definitely dropping and switching between speeds the error counts never advanced as it eventually recovered and sent the data. I believe these are only unrecoverable errors that are otherwise not explained by the cable being unplugged or somethign similar.
Network Interface ID (nic): This is the lower level name of the interface you wish to get info from. To get a list of the active network interfaces on your machine see the section below on Finding the Network Interface ID.
Data Type: Select the type of data you would like the Unit to display. For this unit the available values are: “Bytes Sent”, “Bytes Received”, “Packets Sent”, “Packets Received”, “Errors In”, “Errors Out”, “Dropped In” and “Dropped Out.” Calculate Delta: In the case of Bytes and Packets the values continue to increase over time which is not as easy to visualize what is actually happening than if you calculate a delta between one value and the next. If this is checked then the value of the Unit will be set to the difference between the previous reading and the new reading. This probably does not make sense to set for the Error values, but is very helpful for the bytes and packet values. This is how the graph at the top of this article was generated. Provide Human Readable Labels:” If this is checked then the label for the value of the Unit which is what is displayed in any unit value display, will be an easily readable approximation of the value. Such as “5G”, “542M” or “329K.” The actual value of the Unit will always be the raw, unprocessed value coming from the interface and can be used for graphing or use in other scripts even if this is set to make it more readable here.
Finding The Network Interface ID:
To find the Network Interface ID or NIC that you need to enter into the Network Interface Info Unit startup a Terminal window and enter the following command:
networksetup -listallhardwareports
This will output a very readable list of all the currently configured network interface, regardless of if they are in use or not. If you have given them descriptive names in the Network control panel those should be used here. Here is an example of my output:
networksetup -listallhardwareports

Hardware Port: Thunderbolt Ethernet Slot 2
Device: en4
Ethernet Address: ??:??:??:??:??:??

Hardware Port: Ethernet Adapter (en5)
Device: en5
Ethernet Address: ??:??:??:??:??:??

Hardware Port: Ethernet Adapter (en6)
Device: en6
Ethernet Address: ??:??:??:??:??:??

Hardware Port: Ethernet Adapter (en7)
Device: en7
Ethernet Address: ??:??:??:??:??:??

Hardware Port: Wi-Fi
Device: en0
Ethernet Address: ??:??:??:??:??:??

Hardware Port: Thunderbolt 1
Device: en1
Ethernet Address: ??:??:??:??:??:??

Hardware Port: Thunderbolt 2
Device: en2
Ethernet Address: ??:??:??:??:??:??

Hardware Port: Thunderbolt 3
Device: en3
Ethernet Address: ??:??:??:??:??:??

Hardware Port: Thunderbolt Bridge
Device: bridge0
Ethernet Address: ??:??:??:??:??:??

VLAN Configurations
===================
The value you’re interested in is after the Device: label. You’ll notice that most interfaces start with en and then a number. They should keep the same numbering through reboots and such but reconfiguring the interfaces or starting up a different one may change what you’re looking for so keep in mind to verify that the numbers haven’t changed.
If there are still questions about which interface is the one you’re interested in you can also use the “ifconfig” command to get a more detailed output of the interfaces and their status. This will allow you to see the IP addresses associated with the interfaces which may help to find the correct one.
This is the value that you would use in the Network Interface ID (nic) field in the Network Interface Info Unit.
History:
- The SysInfo plugin was added to XTension in version 9.5.2 in April of 2023

