Using the Log Window
The Log Window in XTension has very useful features for debugging and following specific units or interfaces to see whats going on and aid in developing scripts. The 9.1 version of XTension brings significant updates to the log window with searching and filtering and the ability to switch between logging modes without losing data. The default cache size for searching the log in memory is 10k lines but can be increased in increments to as many as 100k in the log tab of the Preferences Window. This uses more memory but otherwise does not increase the CPU usage though it many slow down slightly when clicking the next and previous buttons when searching since so many more lines need to be walked through to find the next one to highlight.

When switching between log modes the entirety of available log data is re-filtered for the new selection. In previous versions of XTension changing from “show all” to “database items only” or “Exceptions” did not change the data that was already displayed in the window. It only changed the new lines that were added. In 9.1 you can change back and forth between these settings and the entire memory cache of the log is refreshed into the window based on the new settings, so no log lines are lost. The display in the bottom right hand corner of the log by default shows the time span of the available cache for searching and filtering. By clicking on it you can toggle between showing the time frame and the count of lines in the cache. The new log window supports traditional highlighting instead of enforcing line by line highlighting as previous versions did. Click and drag to highlight, auto scrolling is disabled while selecting so it won’t scroll the text up as you’re dragging. Double click to select whole words as you drag and triple click to select entire lines. Copying the selected text preserves the formatting and coloring of the individual log lines. In 9.1 you can also scroll to the left again to read or highlight longer log lines.
Show All, Database Items Only, and Exceptions and User Log Items are called “Log Modes” and affect what log lines are currently visible in your log window.
- Show All as it’s name implies shows all log lines added. This is the default mode.
- Database Items Only this mode suppresses the log lines that show when values are displayed for addresses that don’t yet exist in the XTension database. If you don’t have a unit to receive the update for a received command it would be filtered out if this mode is selected.
- Exceptions and User Log Items Previous to 9.1 this was just called “Exceptions Only” but it allowed anything that wasn’t logged in black to display, so a more appropriate name is exceptions and user Log Items. The Write Log command in a script defaults to logging in Blue unless you specify a color. This log mode suppresses any items that are logged in black but shows any log line in any other color, or any log line specified with the new “with always showing” property of the Write Log command.
Remember that after 9.1 you can switch between these and the entire log buffer is rebuilt to show you the new display without losing any data. No log lines are actually lost of course, regardless of this setting all log lines are always written to the log file.
- Search clicking this toolbar item opens a standard search bar in the window. The log is now searchable. Any matches will highlight and use the arrow buttons to move through the log.
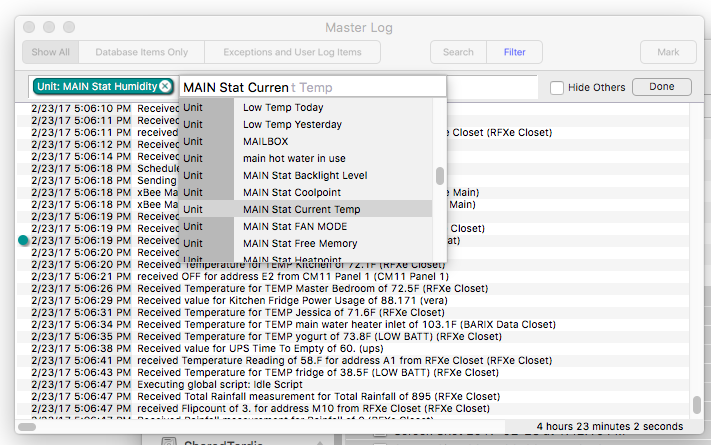
- Filter is my personal favorite new feature of 9.1 for the logs. You can specifically mark log lines that occur during global script running, unit script running or interface reception. If you want to mark all log lines that happened when a specific interface received a command just click in the filter field and start typing the unit, interface or script name to create a filter for it.

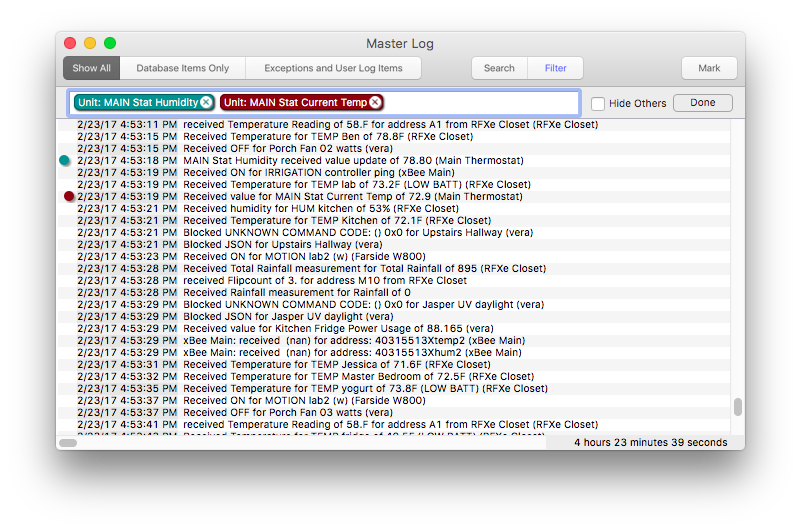
You can add as many filters as you want and the color badge will appear in front of any log line that was generated while that filter was true. As a shortcut to typing the unit, script or interface name you can control or right click on a specific log line and the contextual menu will offer you the option of creating a filter for any items that are valid for that log line. You can also copy the line or jump directly to editing the Unit, Script or Interface responsible for the log.

Multiple filters will show multiple colored tags

clicking the “hide others” checkbox will show only those items that match the filters.

Another feature of 9.1 is the ability to create multiple log windows at the same time. If you have your master log window setup in a useful way you can select “duplicate” from the edit menu to create a new custom log window with the same settings. It will be available in the custom log window menu list under the windows menu from them on until you delete it from the File menu. You can also create a new custom log with blank settings at any time from the file menu. Any number of different views into the log data can be created or be open at once.
Any “mark” log line generated from clicking the “mark” toolbar item will be visible from every log window regardless of filtering. Also any log line written with the “with always showing” option will be visible no matter what the filtering setup is.
If you’d like to always see all the data from just your Vera interface, setup a log with that filter and “hide others” turned on. You can create as many other such custom log windows as you like and they can all be open at the same time.
The log cache is adjustable up to 100k items in the log panel of the XTension preferences window. On my machine 100k log lines only stores about 2 days of data. I might be able to increase that even further now if someone needs even more data to be available for searching at once.
You can combine a search and a filter setting. The settings of these items are saved across restarts.
